

GLOBAL INTANGIBLES · WIPO 2024

The US leads absolute intangible investment
by a wide margin.

Among top economies, US intangible investment reached ~USD 4.6T PPP in 2023 — well ahead of the EU-22 aggregate (~USD 2.7T). France has pulled ahead of Germany and the UK in recent years.

Top economies (T USD PPP)

0.0T1T2T4T5T201320152017201920212023Germany, 2013: 0.3TGermany, 2014: 0.3TGermany, 2015: 0.4TGermany, 2016: 0.4TGermany, 2017: 0.4TGermany, 2018: 0.4TGermany, 2019: 0.5TGermany, 2020: 0.5TGermany, 2021: 0.5TGermany, 2022: 0.6TGermany, 2023: 0.6TFrance, 2013: 0.3TFrance, 2014: 0.4TFrance, 2015: 0.4TFrance, 2016: 0.4TFrance, 2017: 0.4TFrance, 2018: 0.5TFrance, 2019: 0.5TFrance, 2020: 0.5TFrance, 2021: 0.6TFrance, 2022: 0.6TFrance, 2023: 0.7TJapan, 2013: 0.5TJapan, 2014: 0.5TJapan, 2015: 0.5TJapan, 2016: 0.5TJapan, 2017: 0.5TJapan, 2018: 0.5TJapan, 2019: 0.5TJapan, 2020: 0.5TJapan, 2021: 0.5TUnited Kingdom, 2013: 0.4TUnited Kingdom, 2014: 0.4TUnited Kingdom, 2015: 0.4TUnited Kingdom, 2016: 0.4TUnited Kingdom, 2017: 0.4TUnited Kingdom, 2018: 0.4TUnited Kingdom, 2019: 0.5TUnited Kingdom, 2020: 0.5TUnited Kingdom, 2021: 0.5TUnited Kingdom, 2022: 0.5TUnited Kingdom, 2023: 0.6TEU-22, 2013: 1TEU-22, 2014: 1TEU-22, 2015: 2TEU-22, 2016: 2TEU-22, 2017: 2TEU-22, 2018: 2TEU-22, 2019: 2TEU-22, 2020: 2TEU-22, 2021: 2TEU-22, 2022: 3TEU-22, 2023: 3TUnited States, 2013: 3TUnited States, 2014: 3TUnited States, 2015: 3TUnited States, 2016: 3TUnited States, 2017: 3TUnited States, 2018: 3TUnited States, 2019: 3TUnited States, 2020: 4TUnited States, 2021: 4TUnited States, 2022: 4TUnited States, 2023: 5T
GermanyFranceJapanUnited KingdomEU-22United States

Japan data available through 2021.

Selected economies (B USD PPP)

0B270B540B810B1,080B201320152017201920212023Germany, 2013: 325BGermany, 2014: 347BGermany, 2015: 367BGermany, 2016: 397BGermany, 2017: 423BGermany, 2018: 450BGermany, 2019: 493BGermany, 2020: 497BGermany, 2021: 525BGermany, 2022: 568BGermany, 2023: 576BSpain, 2013: 109BSpain, 2014: 117BSpain, 2015: 122BSpain, 2016: 131BSpain, 2017: 137BSpain, 2018: 139BSpain, 2019: 149BSpain, 2020: 143BSpain, 2021: 163BSpain, 2022: 182BSpain, 2023: 189BFrance, 2013: 345BFrance, 2014: 355BFrance, 2015: 369BFrance, 2016: 397BFrance, 2017: 423BFrance, 2018: 451BFrance, 2019: 499BFrance, 2020: 504BFrance, 2021: 560BFrance, 2022: 634BFrance, 2023: 678BIndia, 2013: 34BIndia, 2014: 35BIndia, 2015: 41BIndia, 2016: 45BIndia, 2017: 43BIndia, 2018: 48BIndia, 2019: 52BIndia, 2020: 45BItaly, 2013: 168BItaly, 2014: 173BItaly, 2015: 180BItaly, 2016: 198BItaly, 2017: 205BItaly, 2018: 216BItaly, 2019: 234BItaly, 2020: 230BItaly, 2021: 253BItaly, 2022: 278BItaly, 2023: 287BJapan, 2013: 458BJapan, 2014: 465BJapan, 2015: 481BJapan, 2016: 467BJapan, 2017: 467BJapan, 2018: 475BJapan, 2019: 493BJapan, 2020: 487BJapan, 2021: 511BNetherlands (Kingdom of the), 2013: 113BNetherlands (Kingdom of the), 2014: 109BNetherlands (Kingdom of the), 2015: 151BNetherlands (Kingdom of the), 2016: 121BNetherlands (Kingdom of the), 2017: 128BNetherlands (Kingdom of the), 2018: 134BNetherlands (Kingdom of the), 2019: 143BNetherlands (Kingdom of the), 2020: 148BNetherlands (Kingdom of the), 2021: 163BNetherlands (Kingdom of the), 2022: 182BNetherlands (Kingdom of the), 2023: 193BPoland, 2013: 72BPoland, 2014: 76BPoland, 2015: 82BPoland, 2016: 87BPoland, 2017: 93BPoland, 2018: 100BPoland, 2019: 110BPoland, 2020: 113BPoland, 2021: 120BPoland, 2022: 137BPoland, 2023: 144BSweden, 2013: 65BSweden, 2014: 70BSweden, 2015: 72BSweden, 2016: 74BSweden, 2017: 82BSweden, 2018: 86BSweden, 2019: 90BSweden, 2020: 97BSweden, 2021: 110BSweden, 2022: 122BSweden, 2023: 126BUnited Kingdom, 2013: 352BUnited Kingdom, 2014: 366BUnited Kingdom, 2015: 384BUnited Kingdom, 2016: 399BUnited Kingdom, 2017: 420BUnited Kingdom, 2018: 436BUnited Kingdom, 2019: 474BUnited Kingdom, 2020: 490BUnited Kingdom, 2021: 517BUnited Kingdom, 2022: 548BUnited Kingdom, 2023: 550B
GermanySpainFranceIndiaItalyJapanNetherlands (Kingdom of the)PolandSwedenUnited Kingdom

India data available through 2020 (fiscal year Jul–Jun).

INDIA FOCUS

India's intangibles are rising faster
than tangibles.

Indexed to 2011, intangible investment (formal + informal) outpaced tangible investment through 2020 — even as both dipped in the pandemic year.

India indexed (2011=100)

04285127169201120132015201720192020Intangible investment (total), 2011: 100Intangible investment (total), 2012: 111Intangible investment (total), 2013: 118Intangible investment (total), 2014: 118Intangible investment (total), 2015: 142Intangible investment (total), 2016: 154Intangible investment (total), 2017: 139Intangible investment (total), 2018: 150Intangible investment (total), 2019: 157Intangible investment (total), 2020: 133Tangible investment (total), 2011: 100Tangible investment (total), 2012: 102Tangible investment (total), 2013: 90Tangible investment (total), 2014: 88Tangible investment (total), 2015: 95Tangible investment (total), 2016: 102Tangible investment (total), 2017: 114Tangible investment (total), 2018: 126Tangible investment (total), 2019: 120Tangible investment (total), 2020: 108trend_IA, 2011: 109trend_IA, 2012: 114trend_IA, 2013: 119trend_IA, 2014: 124trend_IA, 2015: 130trend_IA, 2016: 135trend_IA, 2017: 140trend_IA, 2018: 145trend_IA, 2019: 150trend_IA, 2020: 156trend_TA, 2011: 92trend_TA, 2012: 95trend_TA, 2013: 98trend_TA, 2014: 100trend_TA, 2015: 103trend_TA, 2016: 106trend_TA, 2017: 109trend_TA, 2018: 112trend_TA, 2019: 115trend_TA, 2020: 117
Intangible investment (total)Tangible investment (total)Trend: IATrend: TA

Formal and informal economy. Chain-linked volumes, reference year 2015.

GDP SHARE

The gap with tangible investment
is narrowing.

As a share of India's GDP (ex-informal), intangibles held near ~10% while tangibles eased from ~24% to ~18.5% (2011–2020). In 2019, India's intangible intensity matched the EU-22 (~10.4%).

India investment / GDP

0%27%54%81%108%201120132015201720192020Intangible investment, 2011: 9%Intangible investment, 2012: 9%Intangible investment, 2013: 10%Intangible investment, 2014: 10%Intangible investment, 2015: 11%Intangible investment, 2016: 11%Intangible investment, 2017: 10%Intangible investment, 2018: 10%Intangible investment, 2019: 10%Intangible investment, 2020: 9%Tangible investment, 2011: 24%Tangible investment, 2012: 23%Tangible investment, 2013: 20%Tangible investment, 2014: 19%Tangible investment, 2015: 20%Tangible investment, 2016: 20%Tangible investment, 2017: 20%Tangible investment, 2018: 21%Tangible investment, 2019: 20%Tangible investment, 2020: 19%trend_IA, 2011: 10%trend_IA, 2012: 10%trend_IA, 2013: 10%trend_IA, 2014: 10%trend_IA, 2015: 10%trend_IA, 2016: 10%trend_IA, 2017: 10%trend_IA, 2018: 10%trend_IA, 2019: 10%trend_IA, 2020: 10%trend_TA, 2011: 22%trend_TA, 2012: 22%trend_TA, 2013: 22%trend_TA, 2014: 21%trend_TA, 2015: 21%trend_TA, 2016: 20%trend_TA, 2017: 20%trend_TA, 2018: 20%trend_TA, 2019: 19%trend_TA, 2020: 19%
Intangible investmentTangible investmentTrend: IATrend: TA

Excludes informal sector.

Investment / GDP (2019)

0%10%20%30%US: Intangible investment 16.2%US: Tangible investment 10.5%USUK: Intangible investment 14.2%UK: Tangible investment 10%UKEU-22: Intangible investment 10.4%EU-22: Tangible investment 12.2%EU-22India: Intangible investment 10.4%India: Tangible investment 19.5%IndiaJapan: Intangible investment 9.1%Japan: Tangible investment 16.1%Japan
Intangible investmentTangible investment
CROSS-COUNTRY PATTERN

Richer economies invest more
in intangibles.

Intangible intensity rises with GDP per capita. India sits above the trend line — higher intensity than its income level alone would predict.

Intensity vs GDP per capita

3%8%12%17%$5k$33k$60kBulgaria: $19k GDP per capita, 6% intensityCzechia: $34k GDP per capita, 11% intensityGermany: $48k GDP per capita, 10% intensityDenmark: $50k GDP per capita, 13% intensityEstonia: $30k GDP per capita, 11% intensityGreece: $27k GDP per capita, 6% intensitySpain: $35k GDP per capita, 8% intensityFinland: $44k GDP per capita, 14% intensityFrance: $41k GDP per capita, 15% intensityFRCroatia: $24k GDP per capita, 9% intensityHungary: $27k GDP per capita, 9% intensityIndia: $6k GDP per capita, 6% intensityINDItaly: $38k GDP per capita, 9% intensityJapan: $41k GDP per capita, 9% intensityLithuania: $30k GDP per capita, 9% intensityLatvia: $25k GDP per capita, 9% intensityNetherlands: $51k GDP per capita, 14% intensityPoland: $27k GDP per capita, 8% intensityPortugal: $30k GDP per capita, 9% intensityRomania: $23k GDP per capita, 9% intensitySweden: $49k GDP per capita, 16% intensitySESlovenia: $33k GDP per capita, 10% intensitySlovakia: $30k GDP per capita, 9% intensityUnited Kingdom: $42k GDP per capita, 14% intensityUnited States: $57k GDP per capita, 15% intensityUS

GDP per capita (PPP) · intangible investment intensity

India excludes informal sector. Averages for 2011–2020.

2006Since
August 2006
8+IP Domains
Full Spectrum
2002Patent Agent
Registered Since
100%Confidential
Solo Practice
20 YEARS · 2006–2026

Twenty Years of Intellectual Property Lab

On August 5, Intellectual Property Lab completes twenty years since its founding in 2006.

It did not begin as a plan to build a firm. As the eldest son in the family, and as a gold medallist who had reason to look toward the country's larger legal and IP centres, the first responsibility was closer to home — to my parents. That choice meant building an IP practice from outside the metro towns where most of India's patent and trademark work is concentrated, without a mentor to guide the way, and without the networks that usually come with those centres. What there was, instead, was a determination to take whatever work came and do it as well as it could be done.

Over twenty years, that approach has held. Intellectual Property Lab has grown into a practice spanning patents, trademarks, copyright, geographical indications, and industrial designs, with offices in Lucknow and Dehradun, serving clients across India and internationally.

A few things have not changed in that time, and will not:

  • Confidentiality is absolute. What a client shares with us stays with us — even in the rare instance that the relationship ends.
  • Client relationships are not currency. We do not invoke one client's name to win another's business.
  • The practice has grown on its own terms. Every year of these twenty has been self-sustained, without external debt.

What has mattered most, though, is the people. Many clients who came to us for a single matter stayed on as long-term relationships — and quite a few, over the years, became genuine friends. That trust is the real measure of these twenty years, far more than any other metric.

To every client, colleague, and well-wisher who has been part of this journey — thank you. We look forward to the years ahead, toward a silver jubilee and, in time, a golden one, continuing the same work in the same spirit it began with.

— Rahul Dutta, Founder, Intellectual Property Lab

FIRM OVERVIEW

Intellectual Property Lab at a Glance

Intellectual Property Lab is a premier IP law boutique established in August 2006. Our solo practice combines rigorous legal analysis with commercial insight, serving IP stakeholders with personalised attention and utmost confidentiality.

We support clients from first disclosure through filing, prosecution, enforcement, and monetisation — across patents, trademarks, copyrights, designs, geographical indications, trade secrets, and more.

Since August 2006

Best-in-class IP services rendered with a proactive, client-first approach since our founding.

Full-Spectrum IP

Patents, trademarks, copyrights, industrial design, GIs, trade secrets, plant breeder rights, and IC layout design.

Personalised & Confidential

Solo boutique practice ensuring your IP needs are met with professionalism, ethics, and strict confidentiality.

2006

Established

Authenticity, Ethics, and Strategic Advisory.

At IP Lab, we believe intellectual property is the cornerstone of modern enterprise. Our mission is to provide clear, actionable, and ethically grounded legal counsel to innovators, research institutions, and businesses.

We integrate deep technical expertise with legal strategy, ensuring your innovations are protected not just in theory, but in practice.

  • Full-spectrum IP across eight major domains
  • Personalised service with utmost confidentiality
  • Results-oriented counsel since August 2006

Practice Areas

We offer a comprehensive range of services tailored to meet your unique Intellectual Property (IP) needs. Our expertise spans across various domains of IP law.

Patents

We provide robust patent services to protect your innovative inventions and technological advancements — from prior art search and drafting to prosecution and portfolio strategy

Explore Patents

Trademarks

Our trademark services safeguard your brand identity, ensuring your logos, names, and symbols are protected and distinctly recognized in the marketplace.

Explore Trademarks

Copyrights

We help secure your original works of authorship — from books and music to software and architectural designs — with registration, licensing, and enforcement counsel.

Explore Copyrights
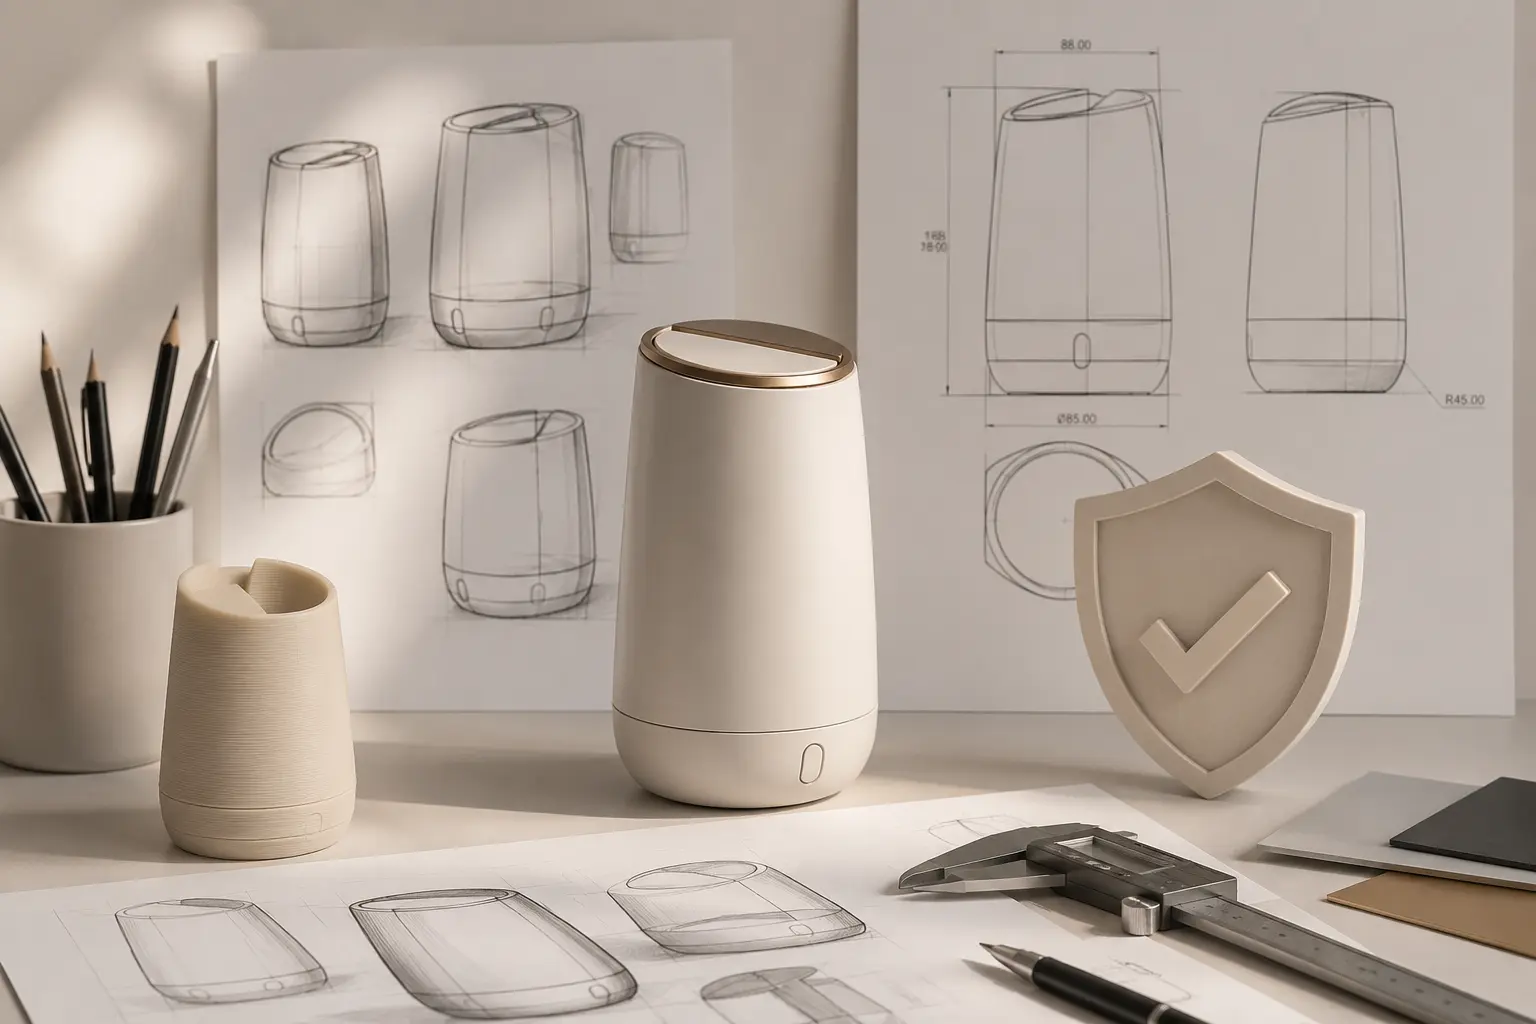
Industrial Design

Our industrial design services preserve the unique appearance of your products, protecting the visual identity that gives you a competitive edge.

Explore Industrial Design

Geographical Indications

We assist in protecting the unique identity of local products, linking quality and reputation to their place of origin through GI registration and enforcement.

Explore Geographical Indications

Infringement

We offer infringement litigation and dispute resolution to defend your IP rights against unauthorized use and pursue remedies when your assets are at risk.

Explore Infringement

Our Structured Approach

  1. 1

    Consultation

    Initial discovery session to understand your innovation and business goals.

  2. 2

    Evaluation

    Thorough prior art search, feasibility analysis, and strategy formulation.

  3. 3

    Protection

    Drafting, filing, and prosecuting applications with the relevant IP offices.

  4. 4

    Enforcement

    Ongoing monitoring, renewal management, and infringement defense.

2006

Established

8+

IP Domains

24h

Response Time

100%

Confidential

Why Clients Choose IP Lab

Experience & Expertise

Founded by Rahul Dutta, Registered Patent Agent since 2002, with LL.M. Gold Medal from NLU Jodhpur and training from the Japan Patent Office.

Ethical & Transparent

We provide honest feasibility assessments upfront and operate with clarity on scope, timelines, and fees.

Client-Centric

As a solo boutique, we act as strategic partners invested in the commercial success of your intellectual property — not just filing paperwork.

Partner with IPLab

Get a preliminary assessment of your IP portfolio or filing strategy. We respond within 24 business hours.

Request Consultation